
Global Power Monitoring Market Size, Share, Trends, Industry Growth by Component (Hardware, Software, Services), by End-Use Industry (Manufacturing & Process Industry, Utilities & Renewables, & Others), by Region, and Forecast to 2028
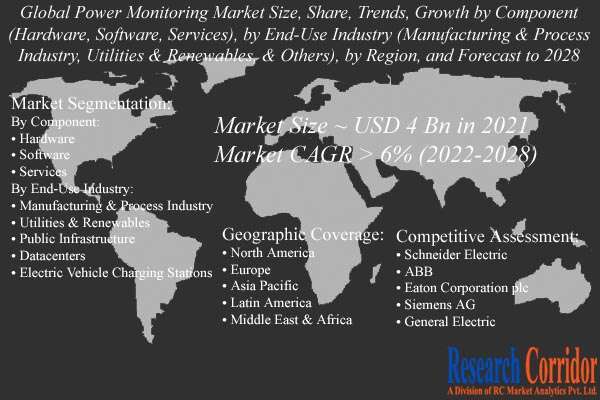
Report ID: RC99985 | Report Format: PDF + Excel | Starting Price: 3600/- USD | Last Updated: June 27th, 2023The global power monitoring market size was valued at around USD 4 billion in 2021 and anticipated to grow at a significant CAGR of over 6% during the forecast period from 2022 to 2028. The increasing inclination toward enhancing energy efficiency and growing focus to reduce energy costs are some major factors driving the market growth. Furthermore, the increasing adoption of these monitoring systems to manage, analyze, and control energy consumption in manufacturing and process industries is further anticipated to boost the market over the forecast period. Moreover, the increasing investment in power monitoring systems by some major players and the growing demand for enhanced operational efficiency is anticipated to propel the market growth. In addition, the rapid growth in urbanization and the growing industrialization in developing economies are anticipated to fuel the market in upcoming years.
Market Drivers:
Increasing demand for energy efficiency: There is a growing emphasis on energy efficiency across various industries and sectors. Power monitoring systems help organizations monitor and analyze their energy consumption patterns, identify areas of energy waste, and implement energy-saving measures. The increasing focus on energy efficiency and sustainability drives the adoption of power monitoring solutions.
Government regulations and initiatives: Governments worldwide are implementing regulations and initiatives to promote energy efficiency and reduce carbon emissions. These regulations often require organizations to monitor and report their energy consumption data. Power monitoring systems enable organizations to comply with these regulations and demonstrate their commitment to sustainable practices. Government policies and incentives that encourage energy monitoring and management also contribute to the growth of the power monitoring market.
Rising electricity costs: The increasing cost of electricity is a significant driver for the adoption of power monitoring systems. Organizations are keen to monitor their energy usage and identify opportunities for cost savings. Power monitoring systems provide real-time insights into energy consumption, allowing organizations to optimize their energy usage, reduce peak demand, and negotiate better electricity pricing contracts. The need to control and manage electricity costs drives the demand for power monitoring solutions.
Growing adoption of renewable energy sources: The integration of renewable energy sources, such as solar and wind, into the power grid introduces new complexities in power management. Power monitoring systems help organizations monitor and manage the flow of electricity from renewable sources, optimize power distribution, and ensure grid stability. With the increasing adoption of renewable energy installations, the demand for power monitoring solutions that support renewable energy integration is also growing.
Need for power quality monitoring: Power quality issues, such as voltage fluctuations, harmonics, and transients, can impact the performance and lifespan of electrical equipment. Power monitoring systems enable organizations to monitor power quality parameters and identify and mitigate potential issues. Industries such as manufacturing, healthcare, data centers, and telecommunications rely on power quality monitoring to ensure the reliability and efficiency of their operations. The need for power quality monitoring drives the adoption of power monitoring solutions.
Data center growth and energy management: The rapid growth of data centers, driven by the increasing demand for cloud computing and digital services, presents significant challenges in energy management. Data centers consume substantial amounts of electricity, and efficient power monitoring is essential for optimizing energy usage, improving cooling efficiency, and ensuring the reliability of critical infrastructure. The expansion of data centers fuels the demand for power monitoring solutions.
Industrial automation and control systems: The adoption of industrial automation and control systems in manufacturing and process industries requires effective power monitoring capabilities. Power monitoring systems enable real-time monitoring of electrical parameters, such as voltage, current, power factor, and energy consumption, in industrial facilities. This data is crucial for optimizing production processes, detecting equipment faults, and improving overall energy efficiency. The increasing adoption of industrial automation drives the demand for power monitoring solutions.
Technological advancements in power monitoring systems: Continuous advancements in power monitoring technologies, such as the integration of IoT (Internet of Things) connectivity, advanced analytics, and cloud-based data management, contribute to the growth of the power monitoring market. These advancements provide organizations with more comprehensive and real-time insights into their energy usage, enable proactive energy management, and facilitate data-driven decision-making.
Market Snapshot:
| Benchmark Year | 2022 | ||
| Market Size | ~ USD 4 Billion in 2021 | ||
| Market Growth (CAGR) | > 6% (2023-2030) | ||
| Largest Market Share | North America | ||
| Analysis Period | 2020-2030 | ||
| Market Players | Schneider Electric, ABB, Eaton Corporation plc, Siemens AG, and General Electric |
Market Insights:
The global power monitoring market is bifurcated into component, end-use industry, and geography. On the basis of components, the market is further segmented into hardware, software, and services. The hardware segment dominated the global market in 2021 and anticipated to hold the largest revenue share of over 2/3 market share by the end of the analysis period. The growing proliferation of smart grid networks and the increasing installation of smart meters are some factors driving the segment growth. Furthermore, the increasing adoption of power monitoring devices and the government regulations regarding carbon emission is further contributing to the segment growth positively.
On the basis of end-use industry, the market is segmented into the manufacturing & process industry, utilities & renewables, public infrastructure, datacenters, and electric vehicle charging stations. The manufacturing & process industry dominated the global power monitoring market in 2021 and expected to grow at the same trend over the forecast period. The greater emphasis on industrial automation and rollout of advanced power monitoring devices has driven the segment growth significantly. Furthermore, the growing focus on improving energy efficiency and increasing demand to reduce operating costs is expected to contribute positively to the segment’s growth.
To know more about the study, request sample papers
The power monitoring comprehensive study analyzes industry trends, market size, competitive analysis, and market forecast – 2022 to 2028. Research Corridor report provides detailed premium insight into the global market and reveals the potential revenue streams, commercial prospects, market drivers, challenges, opportunities, issues, and events affecting the industry. In addition, the report has a dedicated section covering market forecasts and analysis for leading geographies, profiles of major companies operating in the market and expert opinion obtained from interviews with industry executives and experts from prominent companies.
The power monitoring market research report presents the analysis of each segment from 2019 to 2028 considering 2020 as the base year for the research. The compounded annual growth rate (CAGR) for each respective segment is calculated for the forecast period from 2021 to 2027.
Historical & Forecast Period
- 2019-20 – Historical Year
- 2021 – Base Year
- 2022-2028 – Forecast Period
Market Segmentation:
By Component:
- Hardware
- Software
- Services
By End-Use Industry:
- Manufacturing & Process Industry
- Utilities & Renewables
- Public Infrastructure
- Datacenters
- Electric Vehicle Charging Stations
By Region:
- North America
- Europe
- Asia Pacific
- Latin America
- Middle East & Africa
Regional Analysis:
Geographically, North America dominated the global power monitoring market in 2021 and estimated to hold a significant market share of over 1/3 market share by the end of the analysis period. The upgradation of existing power infrastructure by the government to enhance the energy efficiency is a major factor to drive the market growth in the region. Furthermore, the increasing investment by some major players and the government initiative to install smart meters are further anticipated to fuel the market growth in the North America. On the flip side, the Asia Pacific is accounted to register the fastest growth of the market by 2028.
Competitive Assessment:
Some of the major market players operating in the global power monitoring market are Schneider Electric, ABB, Eaton Corporation plc, Siemens AG, and General Electric. Companies are exploring markets through expansion, new investment, the introduction of new services, and collaboration as their preferred strategies. Players are exploring new geography through expansion and acquisition to gain a competitive advantage through joint synergy.
Key Companies:
- Schneider Electric
- ABB
- Eaton Corporation plc
- Siemens AG
- General Electric
- Emerson Electric Co.
- Rockwell Automation, Inc.
- Mitsubishi Electric
- Omron Corporation
- Yokogawa Electric
Key Questions Answered by Power Monitoring Market Report
- Global power monitoring market forecasts from 2022-2028
- Regional market forecasts from 2022-2028 covering Asia-Pacific, North America, Europe, Middle East & Africa, and Latin America
- Country-level forecasts from 2022-2028 covering 15 major countries from the regions as mentioned above
- Power monitoring submarket forecasts from 2022-2028 covering the market by component, by end-use industry, and geography
- Various industry models such as SWOT analysis, Value Chain Analysis about the market
- Analysis of the key factors driving and restraining the growth of the global, regional, and country-level power monitoring markets from 2022-2028
- Competitive Landscape and market positioning of top 10 players operating in the market
1. Preface
1.1. Report Description
1.1.1. Purpose of the Report
1.1.2. Target Audience
1.1.3. USP and Key Offerings
1.2. Research Scope
1.3. Research Methodology
1.3.1. Phase I – Secondary Research
1.3.2. Phase II – Primary Research
1.3.3. Phase III – Expert Panel Review
1.4. Assumptions
2. Executive Summary
2.1. Global Power Monitoring Market Portraiture
2.2. Global Power Monitoring Market, by Component, 2021 (USD Mn)
2.3. Global Power Monitoring Market, by End-Use Industry, 2021 (USD Mn)
2.4. Global Power Monitoring Market, by Geography, 2021 (USD Mn)
3. Global Power Monitoring Market Analysis
3.1. Power Monitoring Market Overview
3.2. Market Inclination Insights
3.3. Market Dynamics
3.3.1. Drivers
3.3.2. Challenges
3.3.3. Opportunities
3.4. Attractive Investment Proposition
3.5. Competitive Analysis
3.6. Porter’s Five Force Analysis
3.6.1. Bargaining Power of Suppliers
3.6.2. Bargaining Power of Buyers
3.6.3. Threat of New Entrants
3.6.4. Threat of Substitutes
3.6.5. Degree of Competition
3.7. COVID-19 Impact Analysis
4. Global Power Monitoring Market By Component, 2019 – 2028 (USD Mn)
4.1. Overview
4.2. Hardware
4.3. Software
4.4. Services
5. Global Power Monitoring Market By End-Use Industry, 2019 – 2028 (USD Mn)
5.1. Overview
5.2. Manufacturing & Process Industry
5.3. Utilities & Renewables
5.4. Public Infrastructure
5.5. Datacenters
5.6. Electric Vehicle Charging Stations
6. North America Power Monitoring Market Analysis and Forecast, 2019 – 2028 (USD Mn)
6.1. Overview
6.2. North America Power Monitoring Market by Component, (2019-2028 USD Mn)
6.3. North America Power Monitoring Market by End-Use Industry, (2019-2028 USD Mn)
6.4. North America Power Monitoring Market by Country, (2019-2028 USD Mn)
6.4.1. U.S.
6.4.1.1. U.S. Power Monitoring Market by Component, (2019-2028 USD Mn)
6.4.1.2. U.S. Power Monitoring Market by End-Use Industry, (2019-2028 USD Mn)
6.4.2. Canada
6.4.2.1. Canada Power Monitoring Market by Component, (2019-2028 USD Mn)
6.4.2.2. Canada Power Monitoring Market by End-Use Industry, (2019-2028 USD Mn)
7. Europe Power Monitoring Market Analysis and Forecast, 2019 – 2028 (USD Mn)
7.1. Overview
7.2. Europe Power Monitoring Market by Component, (2019-2028 USD Mn)
7.3. Europe Power Monitoring Market by End-Use Industry, (2019-2028 USD Mn)
7.4. Europe Power Monitoring Market by Country, (2019-2028 USD Mn)
7.4.1. Germany
7.4.1.1. Germany Power Monitoring Market by Component, (2019-2028 USD Mn)
7.4.1.2. Germany Power Monitoring Market by End-Use Industry, (2019-2028 USD Mn)
7.4.2. U.K.
7.4.2.1. U.K. Power Monitoring Market by Component, (2019-2028 USD Mn)
7.4.2.2. U.K. Power Monitoring Market by End-Use Industry, (2019-2028 USD Mn)
7.4.3. France
7.4.3.1. France Power Monitoring Market by Component, (2019-2028 USD Mn)
7.4.3.2. France Power Monitoring Market by End-Use Industry, (2019-2028 USD Mn)
7.4.4. Italy
7.4.4.1. Italy Power Monitoring Market by Component, (2019-2028 USD Mn)
7.4.4.2. Italy Power Monitoring Market by End-Use Industry, (2019-2028 USD Mn)
7.4.5. Rest of Europe
7.4.5.1. Rest of Europe Power Monitoring Market by Component, (2019-2028 USD Mn)
7.4.5.2. Rest of Europe Power Monitoring Market by End-Use Industry, (2019-2028 USD Mn)
8. Asia Pacific Power Monitoring Market Analysis and Forecast, 2019 – 2028 (USD Mn)
8.1. Overview
8.2. Asia Pacific Power Monitoring Market by Component, (2019-2028 USD Mn)
8.3. Asia Pacific Power Monitoring Market by End-Use Industry, (2019-2028 USD Mn)
8.4. Asia Pacific Power Monitoring Market by Country, (2019-2028 USD Mn)
8.4.1. China
8.4.1.1. China Power Monitoring Market by Component, (2019-2028 USD Mn)
8.4.1.2. China Power Monitoring Market by End-Use Industry, (2019-2028 USD Mn)
8.4.2. Japan
8.4.2.1. Japan Power Monitoring Market by Component, (2019-2028 USD Mn)
8.4.2.2. Japan Power Monitoring Market by End-Use Industry, (2019-2028 USD Mn)
8.4.3. India
8.4.3.1. India Power Monitoring Market by Component, (2019-2028 USD Mn)
8.4.3.2. India Power Monitoring Market by End-Use Industry, (2019-2028 USD Mn)
8.4.4. Rest of Asia Pacific
8.4.4.1. Rest of Asia Pacific Power Monitoring Market by Component, (2019-2028 USD Mn)
8.4.4.2. Rest of Asia Pacific Power Monitoring Market by End-Use Industry, (2019-2028 USD Mn)
9. Latin America (LATAM) Power Monitoring Market Analysis and Forecast, 2019 – 2028 (USD Mn)
9.1. Overview
9.2. Latin America Power Monitoring Market by Component, (2019-2028 USD Mn)
9.3. Latin America Power Monitoring Market by End-Use Industry, (2019-2028 USD Mn)
9.4. Latin America Power Monitoring Market by Country, (2019-2028 USD Mn)
9.4.1. Brazil
9.4.1.1. Brazil Power Monitoring Market by Component, (2019-2028 USD Mn)
9.4.1.2. Brazil Power Monitoring Market by End-Use Industry, (2019-2028 USD Mn)
9.4.2. Mexico
9.4.2.1. Mexico Power Monitoring Market by Component, (2019-2028 USD Mn)
9.4.2.2. Mexico Power Monitoring Market by End-Use Industry, (2019-2028 USD Mn)
9.4.3. Rest of Latin America
9.4.3.1. Rest of Latin America Power Monitoring Market by Component, (2019-2028 USD Mn)
9.4.3.2. Rest of Latin America Power Monitoring Market by End-Use Industry, (2019-2028 USD Mn)
10. Middle East and Africa Power Monitoring Market Analysis and Forecast, 2019 – 2028 (USD Mn)
10.1. Overview
10.2. MEA Power Monitoring Market by Component, (2019-2028 USD Mn)
10.3. MEA Power Monitoring Market by End-Use Industry, (2019-2028 USD Mn)
10.4. Middle East and Africa Power Monitoring Market, by Country, (2019-2028 USD Mn)
10.4.1. GCC
10.4.1.1. GCC Power Monitoring Market by Component, (2019-2028 USD Mn)
10.4.1.2. GCC Power Monitoring Market by End-Use Industry, (2019-2028 USD Mn)
10.4.2. South Africa
10.4.2.1. South Africa Power Monitoring Market by Component, (2019-2028 USD Mn)
10.4.2.2. South Africa Power Monitoring Market by End-Use Industry, (2019-2028 USD Mn)
10.4.3. Rest of MEA
10.4.3.1. Rest of MEA Power Monitoring Market by Component, (2019-2028 USD Mn)
10.4.3.2. Rest of MEA Power Monitoring Market by End-Use Industry, (2019-2028 USD Mn)
11. Company Profiles
11.1. Schneider Electric
11.1.1. Business Description
11.1.2. Financial Health and Budget Allocation
11.1.3. Product Positions/Portfolio
11.1.4. Recent Development
11.1.5. SWOT Analysis
11.2. ABB
11.2.1. Business Description
11.2.2. Financial Health and Budget Allocation
11.2.3. Product Positions/Portfolio
11.2.4. Recent Development
11.2.5. SWOT Analysis
11.3. Eaton Corporation plc
11.3.1. Business Description
11.3.2. Financial Health and Budget Allocation
11.3.3. Product Positions/Portfolio
11.3.4. Recent Development
11.3.5. SWOT Analysis
11.4. Siemens AG
11.4.1. Business Description
11.4.2. Financial Health and Budget Allocation
11.4.3. Product Positions/Portfolio
11.4.4. Recent Development
11.4.5. SWOT Analysis
11.5. General Electric
11.5.1. Business Description
11.5.2. Financial Health and Budget Allocation
11.5.3. Product Positions/Portfolio
11.5.4. Recent Development
11.5.5. SWOT Analysis
11.6. Emerson Electric Co.
11.6.1. Business Description
11.6.2. Financial Health and Budget Allocation
11.6.3. Product Positions/Portfolio
11.6.4. Recent Development
11.6.5. SWOT Analysis
11.7. Rockwell Automation, Inc.
11.7.1. Business Description
11.7.2. Financial Health and Budget Allocation
11.7.3. Product Positions/Portfolio
11.7.4. Recent Development
11.7.5. SWOT Analysis
11.8. Mitsubishi Electric
11.8.1. Business Description
11.8.2. Financial Health and Budget Allocation
11.8.3. Product Positions/Portfolio
11.8.4. Recent Development
11.8.5. SWOT Analysis
11.9. Omron Corporation
11.9.1. Business Description
11.9.2. Financial Health and Budget Allocation
11.9.3. Product Positions/Portfolio
11.9.4. Recent Development
11.9.5. SWOT Analysis
11.10. Yokogawa Electric
11.10.1. Business Description
11.10.2. Financial Health and Budget Allocation
11.10.3. Product Positions/Portfolio
11.10.4. Recent Development
11.10.5. SWOT Analysis
$ 6995/- Corporate License

Email: sales@researchcorridor.com
- Markets in over 100+ countries analyzed granularly
- 35% of our total client are returning clients
- 1000+ customers globally
- 100+ paid data sources mined to bring cutting-edge insights
- 24x5 availability - we are always there when you need us
- "Free of Cost Report Customization" is available
- Request a regional report at Best Price

- Vibration Monitoring Market Report
- Extracorporeal CO2 Removal Devices Market Report
- Friction Stir Welding Equipment Market Report
- Aseptic Filling Machines Market Report
- Range Cookers Market Report
- Industrial Food Blanchers Market Report
- Aseptic Packaging Equipment Market Report
- Indoor Climbing Walls Market Report
- Fire Extinguisher Inspection Services Market Report
- Arbovirus Testing Market Report
- Fire Extinguisher Refilling Services Market Report
- DNA Barcoding Services Market Report
Our Clients


